What is a balance sheet?
A balance sheet lists assets, liabilities and net worth as of a certain date. It can be thought of as a snapshot of your financial condition at that time. A balance sheet is also sometimes referred to as a net worth statement.
For producers whose fiscal year coincides with the calendar year, January 1 is an excellent date for the annual balance sheet. It marks the beginning and ending of their business year, and enables the completion of a good accrual adjusted income statement. Producers, who have a fiscal year different than the calendar year, should complete their annual balance sheet at the beginning of their fiscal year.
Creating a balance sheet
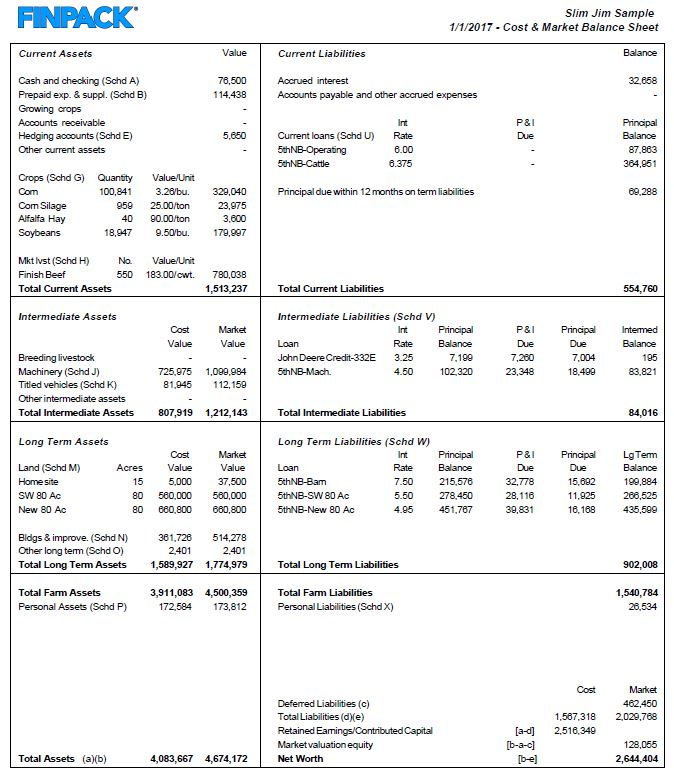
For an example, we’ll use the FINPACK software version of a balance sheet but other balance sheets are structured in a similar way. The assets are on the left side of the page, and the liabilities are on the right. The net worth appears on the bottom right hand side of the page. When you add the liabilities plus the net worth, they will equal the total of the assets. That is where the term “balance” sheet comes from. One side balances with the other.
Assets are items that are owned and have value. They belong on the balance sheet whether these items are paid for in full or whether there is debt against them. The FINPACK balance sheet has horizontal lines dividing the assets between current farm assets, intermediate farm assets and long-term farm assets, followed by total farm assets (the total of the above). Then there are non-farm assets and finally total assets (the total of all farm plus non-farm assets).
Current assets
Current assets are those assets that will likely be converted into cash within a year. Besides cash, other examples of current assets are supplies, accounts receivable, grain and feed that will be marketed directly or through livestock, and market livestock that is held for the purpose of growing, finishing and selling.
Intermediate-term assets
Intermediate-term assets have a longer life in the operation (usually up to 10 years). Although they can be sold, that is not the specific purpose for owning them. Examples are breeding stock, machinery, etc.
Long-term assets
Long-term assets have a long life (usually greater than 10 years). Land, buildings, etc. are examples. These are also sometimes called fixed assets.
The difference between cost value and market value
The FINPACK balance sheet has vertical columns in the intermediate and long-term assets groups marked “cost value” and “market value.” These are different methods of valuing the same assets.
The cost value is the original cost, plus improvements minus depreciation that has been taken over time.
The market value is the value that you could reasonably sell the assets for (on the date of the balance sheet). Current assets have only one “value” (market value).
Some balance sheets use only one valuation method. The accounting world typically uses only the cost value method. Other balance sheets use only the market value method. The FINPACK balance sheet includes both valuation methods. By having both methods, it is possible to calculate a good estimate of the deferred tax liabilities and it gives further meaning to your net worth.
In a completed balance sheet, the amount of total assets in the cost value column is usually different than the amount shown in the market value column.
Each is meaningful in its own way. The cost value total has no inflation in it and has depreciation working against it.
The market value total is not affected by depreciation, and may have significant inflation built into it.
Individual assets that you own may show differences as dramatic as:
-
The cost value of a tractor that you have owned for 20 years may be zero, but the market value may be $20,000.
-
A bare 80 acres that you bought for $600 per acre years ago could have a cost value of $48,000 and a market value of possibly $460,000.
The right side of the balance sheet lists the liabilities. These are obligations owed to others. The FINPACK balance sheet divides the liabilities into groups like the assets side.
Current liabilities
The current liabilities are those obligations that are due and payable within one year. They include:
-
Interest that has accrued as of the date of the balance sheet.
-
Accounts payable that are owed to others.
-
Short-term operating and feeder loans.
-
The principal portion of the longer-term debt that will be due within the year.
Intermediate-term and long-term liabilities
The intermediate-term liabilities and the long-term liabilities are obligations that are due over time. There is no exact time division between intermediate-term loans versus long-term loans but as a rule, the intermediate-term loans are due over the next 10 or fewer years and those longer than 10 years are considered long term.
Equipment loans or some facility loans are good examples of intermediate-term loans. The classic long-term loan is a farmland loan.
The FINPACK balance sheet shows the principal balance (amount owed), the principal due (that portion of the total principal that is due within one year which has already been moved up to the current liabilities category), and then the intermediate or long-term balance (portion of the loan that is due beyond this next year).
If your assets were sold for the market value listed, there would likely be an income tax liability generated by the sale. The deferred liabilities calculated on the FINPACK balance sheet is an estimate of that tax liability. The deferred liabilities are calculated by multiplying a tax rate by the difference between the sale price (market value of the asset) and the tax basis (cost value of the asset). If the deferred tax liability is not included on the balance sheet, the net worth is overstated.
As the liabilities are totaled on the balance sheet, the sum of the cost column is different than the sum of the market column. The cost column equals the total farm liabilities, plus non-farm liabilities. The market column total includes the total farm and non-farm liabilities, plus the deferred liabilities.
Net worth is calculated by subtracting the liabilities from the assets.
Since the FINPACK balance sheet has two columns of assets and two columns of liabilities, there are two components of the net worth:
-
The retained earnings/contributed capital
The total liabilities in the cost column is subtracted from the total assets in the cost value column to calculate retained earnings/contributed capital. The cost value portion of the net worth was earned. The assets are shown at their depreciated values. No inflation is included. In the case of an entity (partnership or corporation), the retained earnings/contributed capital includes the capital that was contributed to the entity. It also represents the retained earnings over the years.
-
The market valuation equity
The total liabilities of the market column is subtracted from the total assets in the market value column to calculate the net worth. This net worth is made up of two parts: the retained earnings/contributed capital (explained above) plus the market valuation equity. Market valuation equity is the change in market value net worth due to market value changes that have nothing to do with farm earnings.
By studying the two components of the net worth, you can identify the portion generated by earned capital (retained earnings/contributed capital) and the effects of inflation (market valuation equity).
What can you learn from a balance sheet?
A balance sheet by itself does not show whether you are making or losing money. It does not show where you have come from or where you are going.
If we think of our balance sheets and the money we spend, here are some questions we need to ask ourselves:
Do the dollars spent for family living show up on balance sheet? Of course not. They are gone.
What about the dollars spent for income taxes? Same thing. They are gone.
What about the dollars spent on principal payment of term debt? They do appear on the balance sheet, because now the liabilities are smaller.
Your balance sheet is just one of the financial statements needed to understand your farm’s yearly financial health, key ratios and measurements. Further understanding of your farm’s finances can be produced by looking at changes in your financial statements over time. For example, by comparing several balance sheets completed over time, you can identify significant trends in your farm business.
Your balance sheet can be analyzed using standard accepted ratios and measurements. By understanding your balance sheet and the key liquidity and solvency ratios and measurements, you can identify strengths and weaknesses in your finances. Learn more about ratios and measurements.
Reviewed in 2023